#BiotechMonday: short features about our facilities
Explore the dropdown menus to discover insights on the equipment, facts, and tools utilized across our core facilities

Bioinformatics
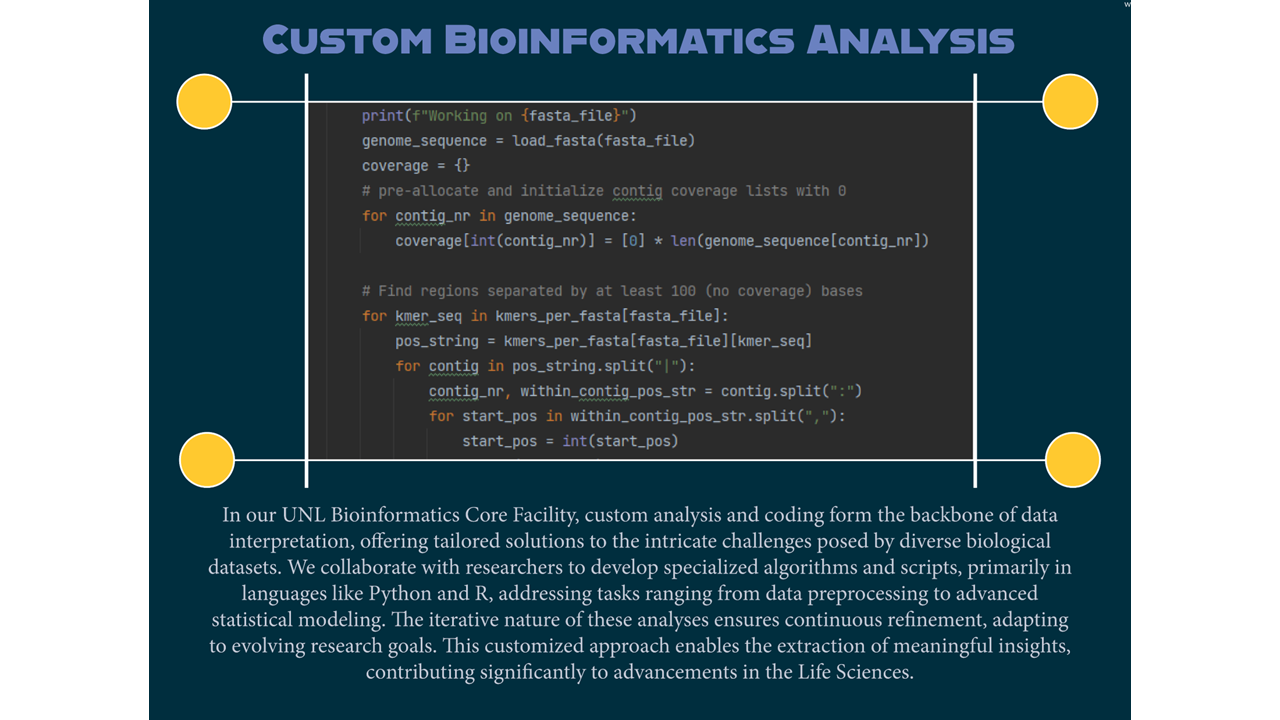
Custom Bioinformatics Analysis
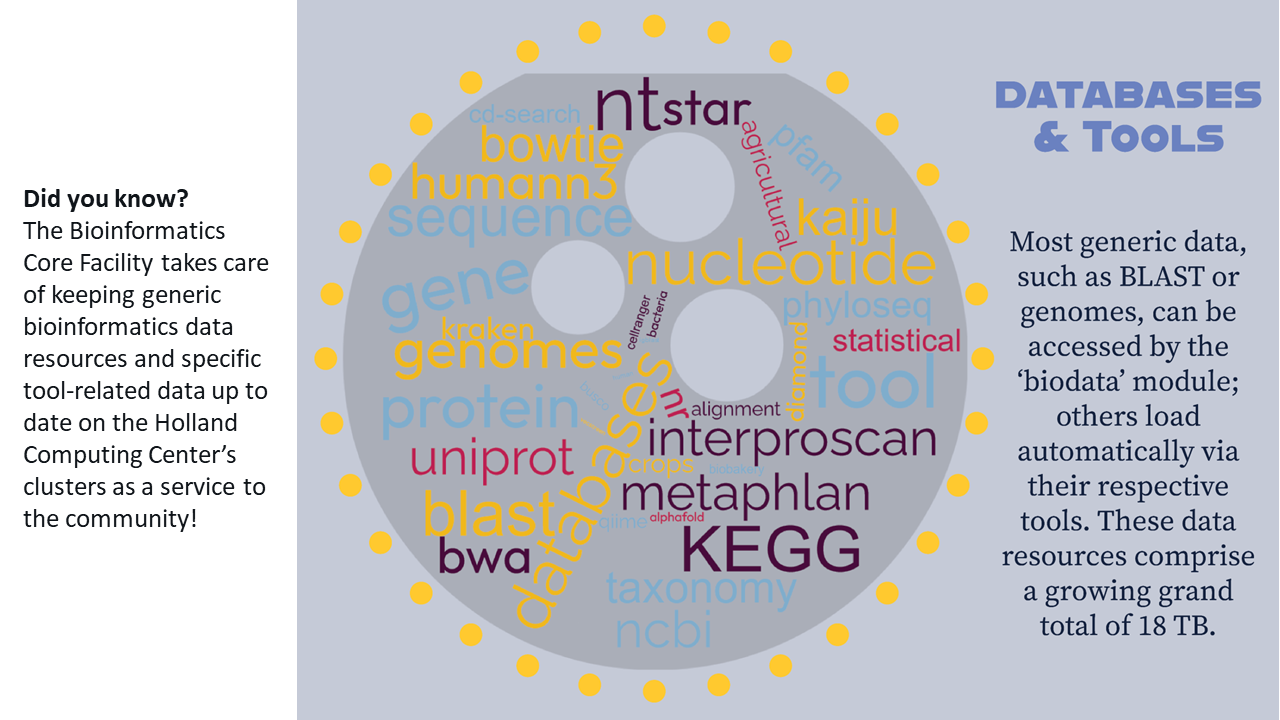
Keeping Resources Current
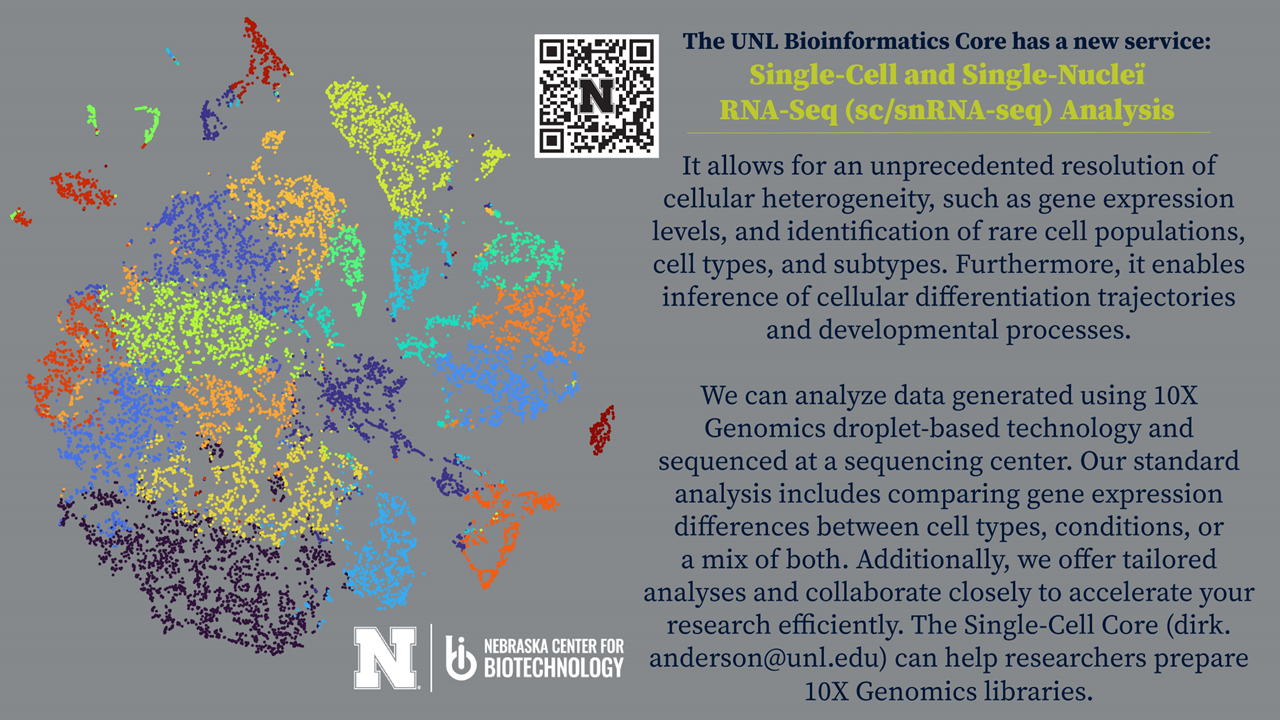
RNA-Seq Analysis
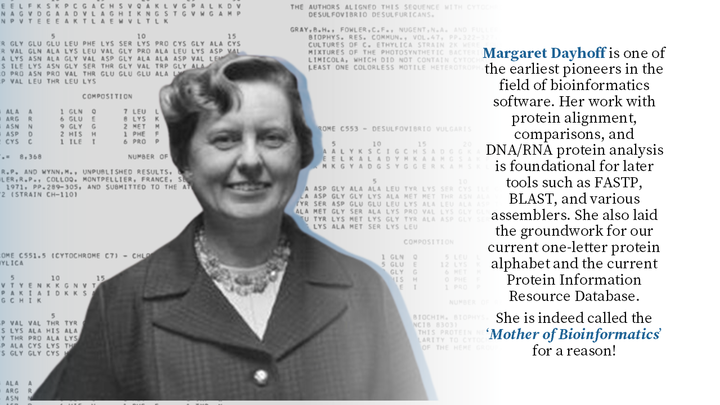
"Mother of Bioinformatics'
CryoEM
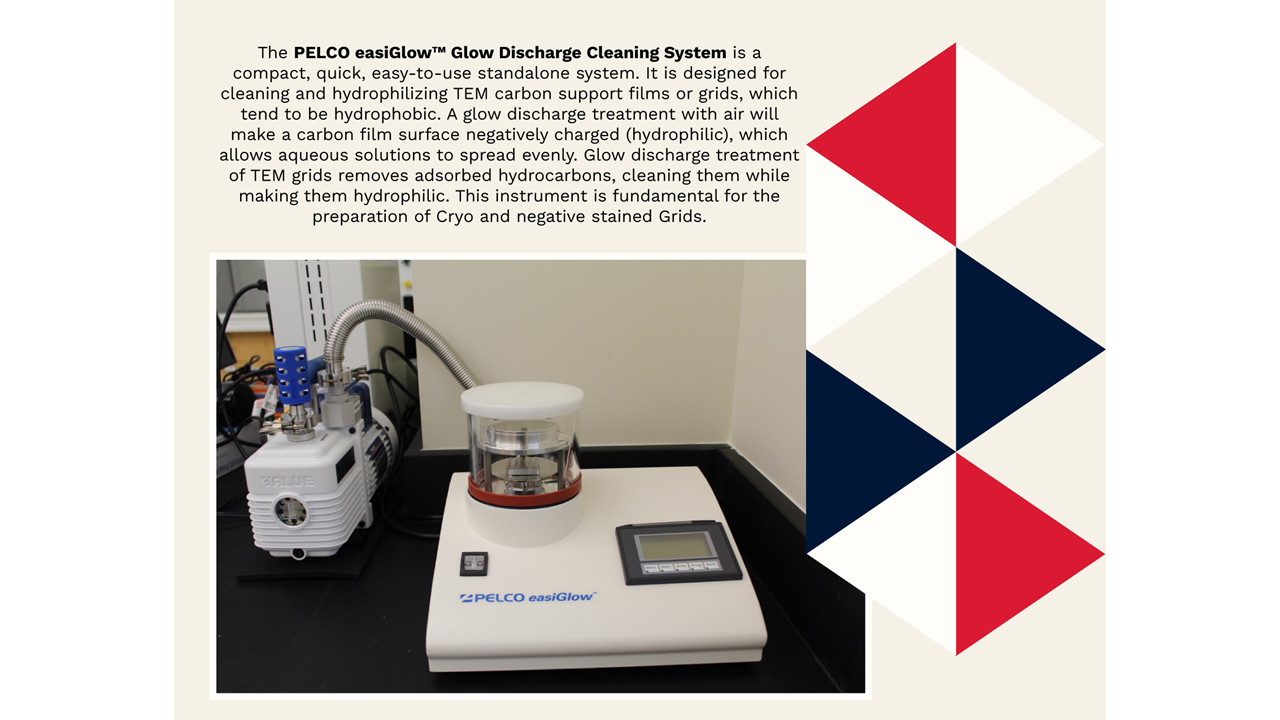
Equipment - PELCO easiGlow Glow Discharge Cleaning System
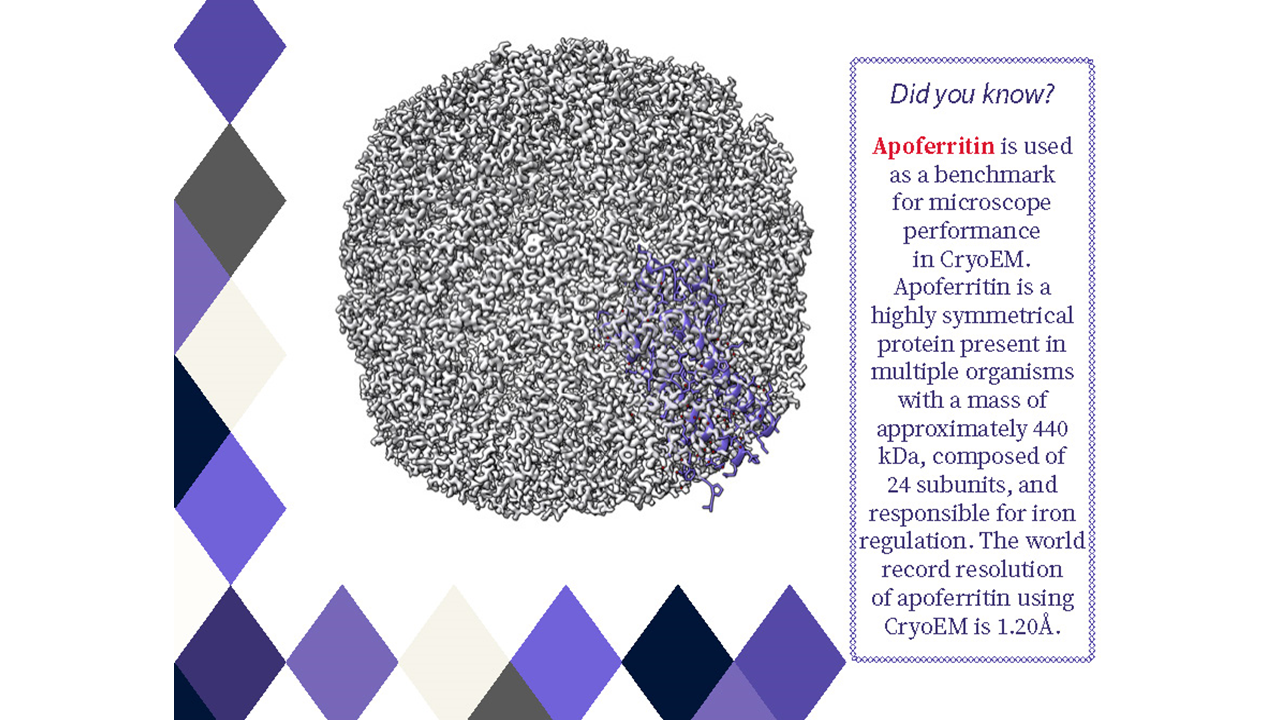
Benchmark Protein - Apoferritin
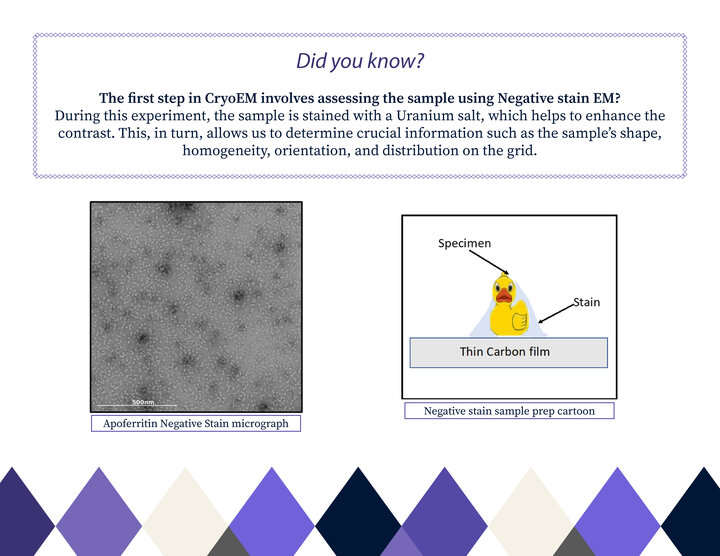
Negative Stain EM
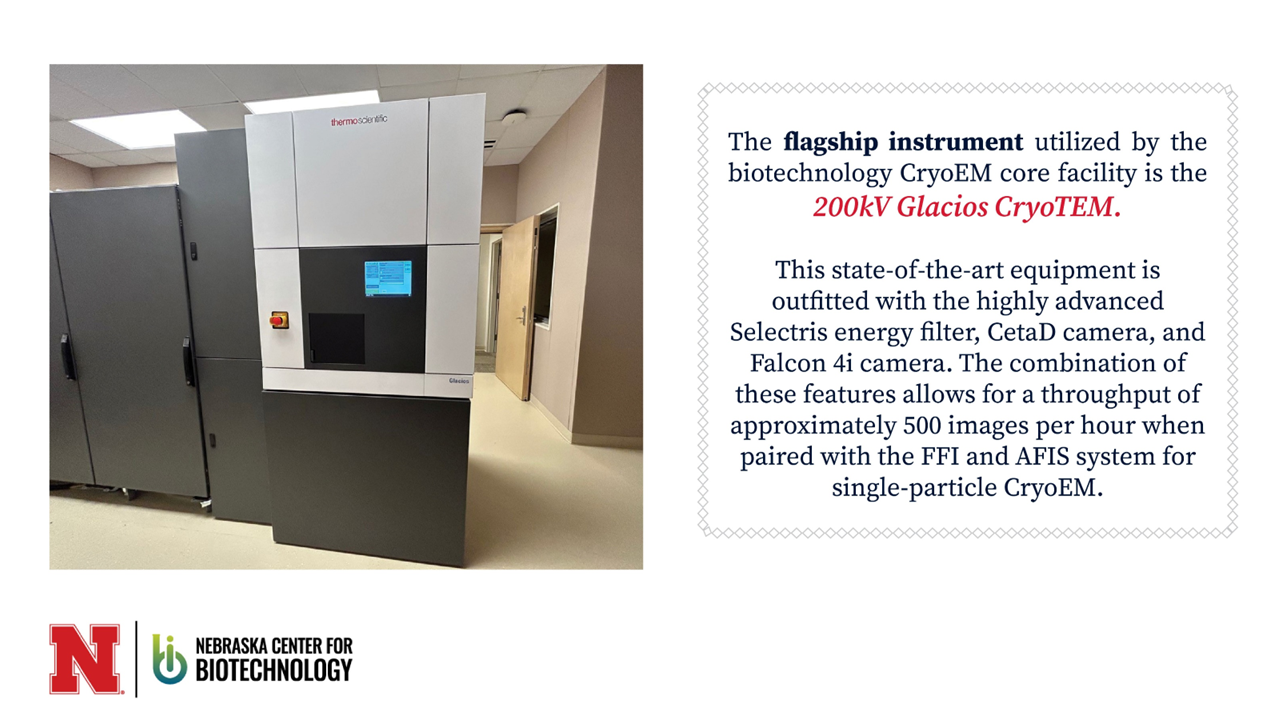
Flagship Instrument - CryoTEM
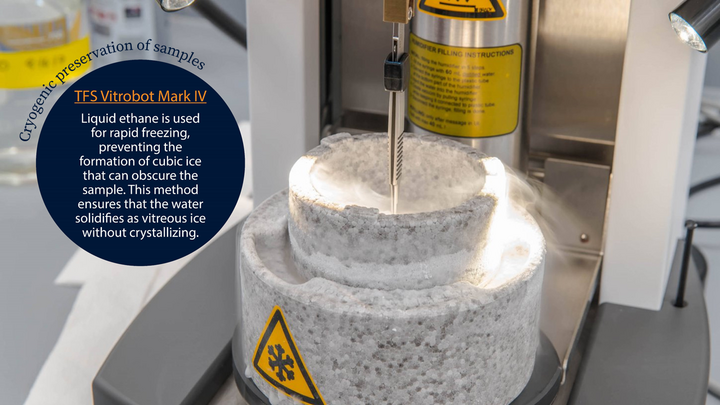
TFS Vitrobot Mark IV
Flow Cytometry
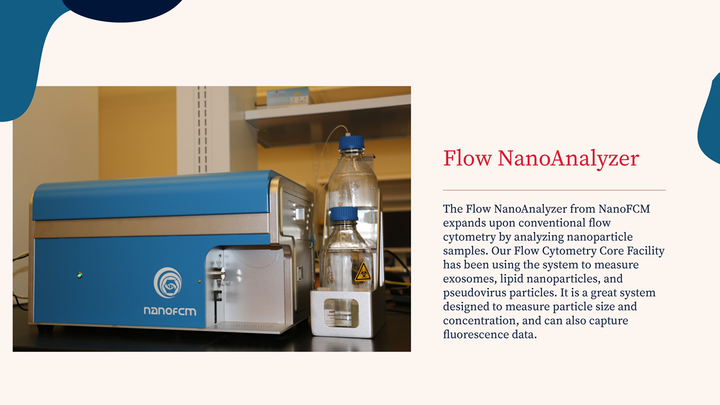
Equipment - Flow NanoAnalyzer
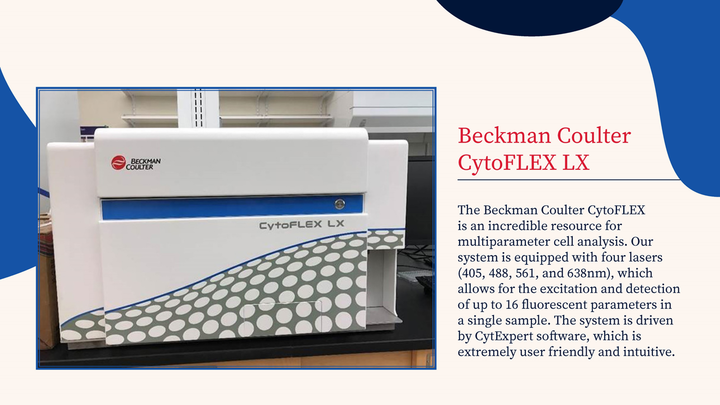
Equipment - CytoFLEX LX
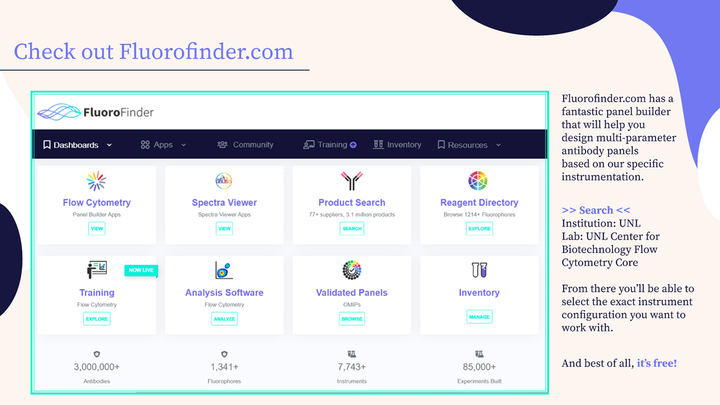
Fluorofinder.com - Design Tools for Flow
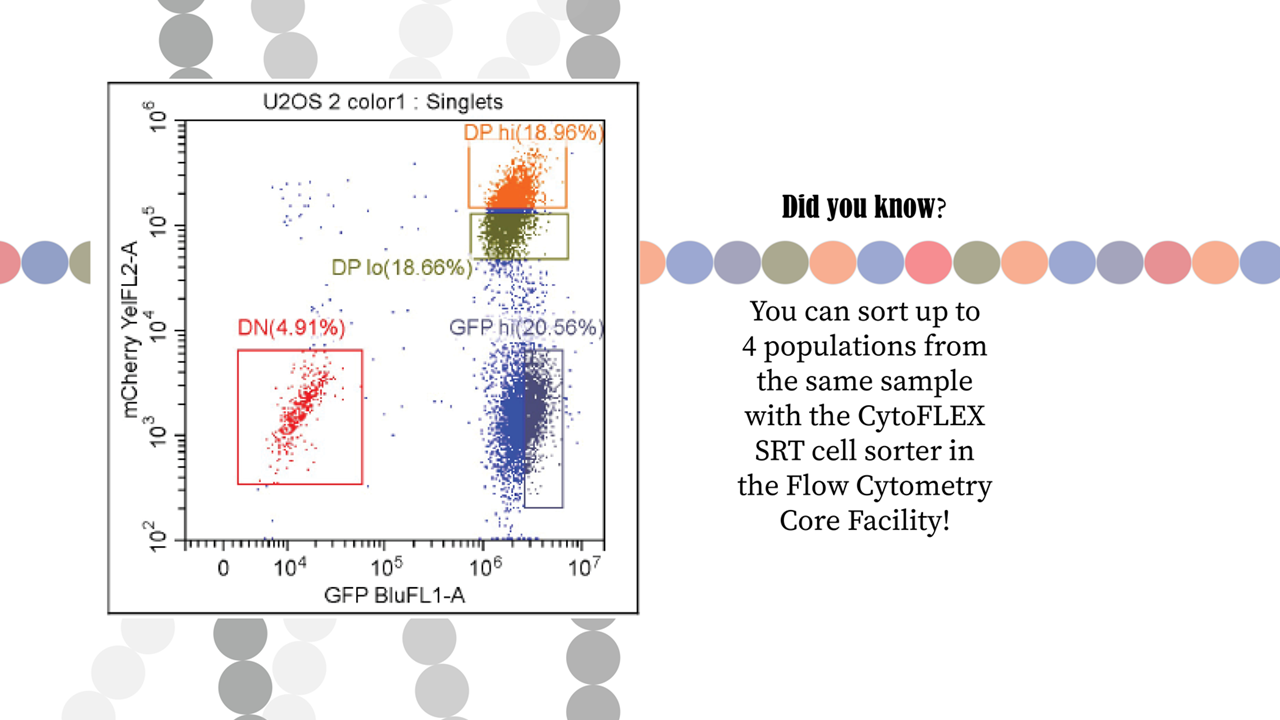
Sorting 4 Populations
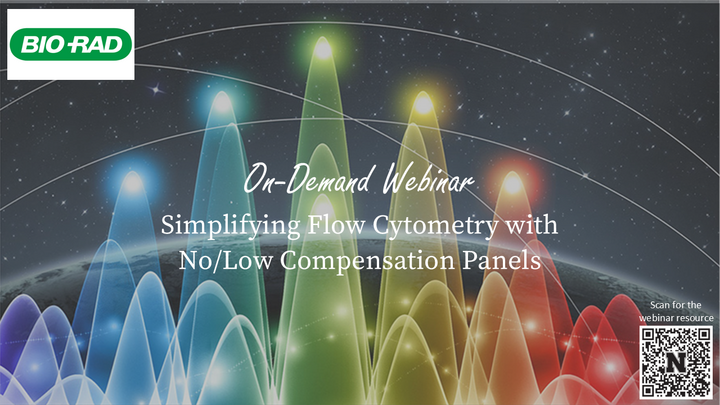
Flow On Demand Webinars
Microscopy
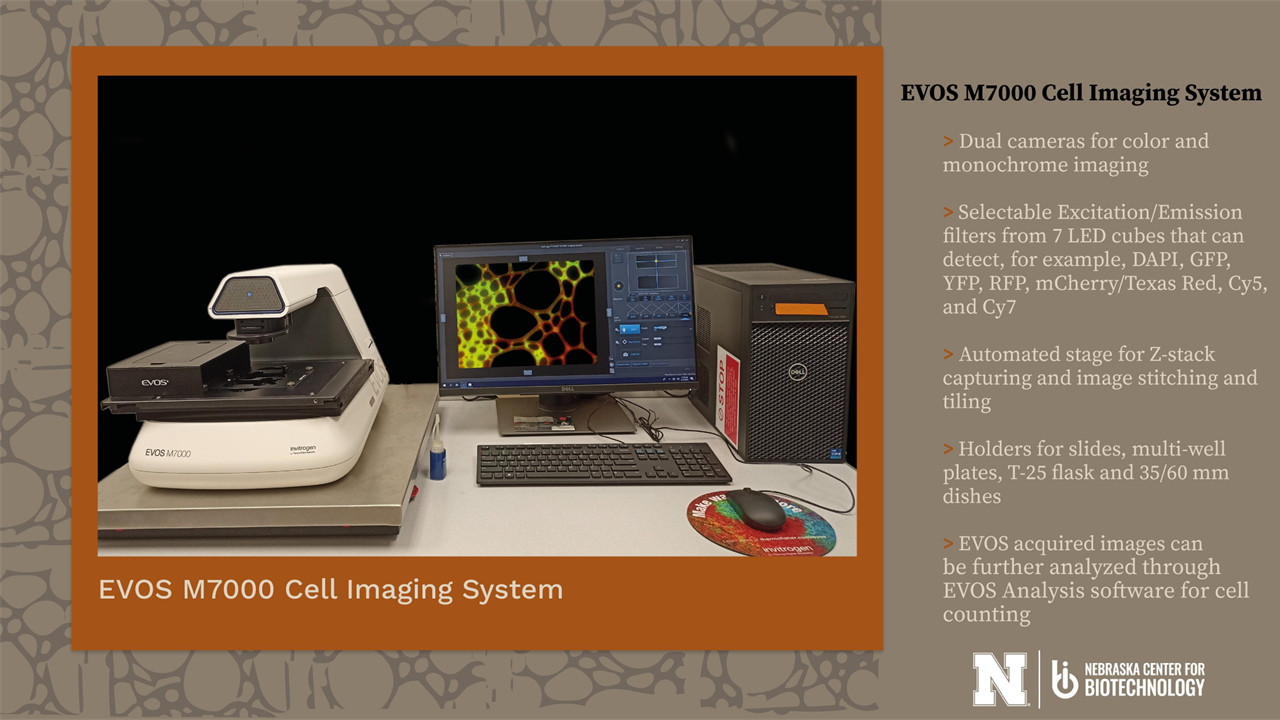
EVOS M7000 Cell Imaging System
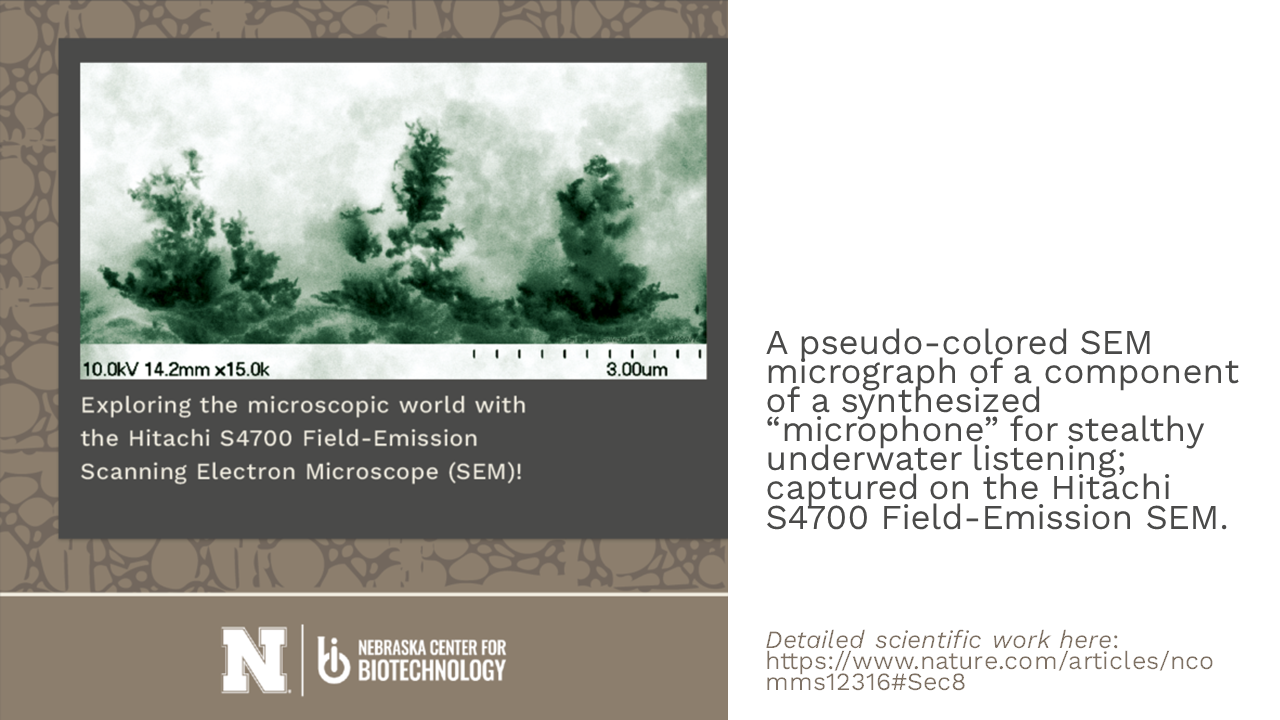
Capturing the underworld with the SEM
The journey from monocular microscopes

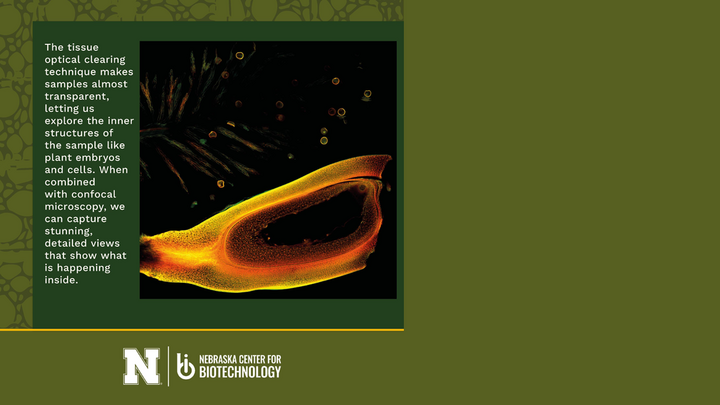
Optical Clearing Technique Image
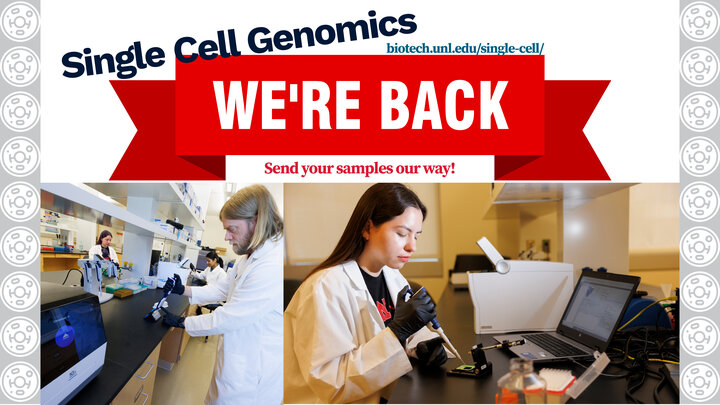
Single Cell Genomics
We're Back!
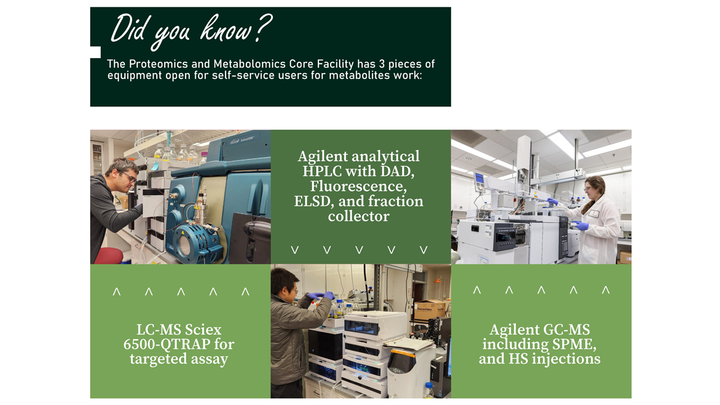
Proteomics and Metabolomics
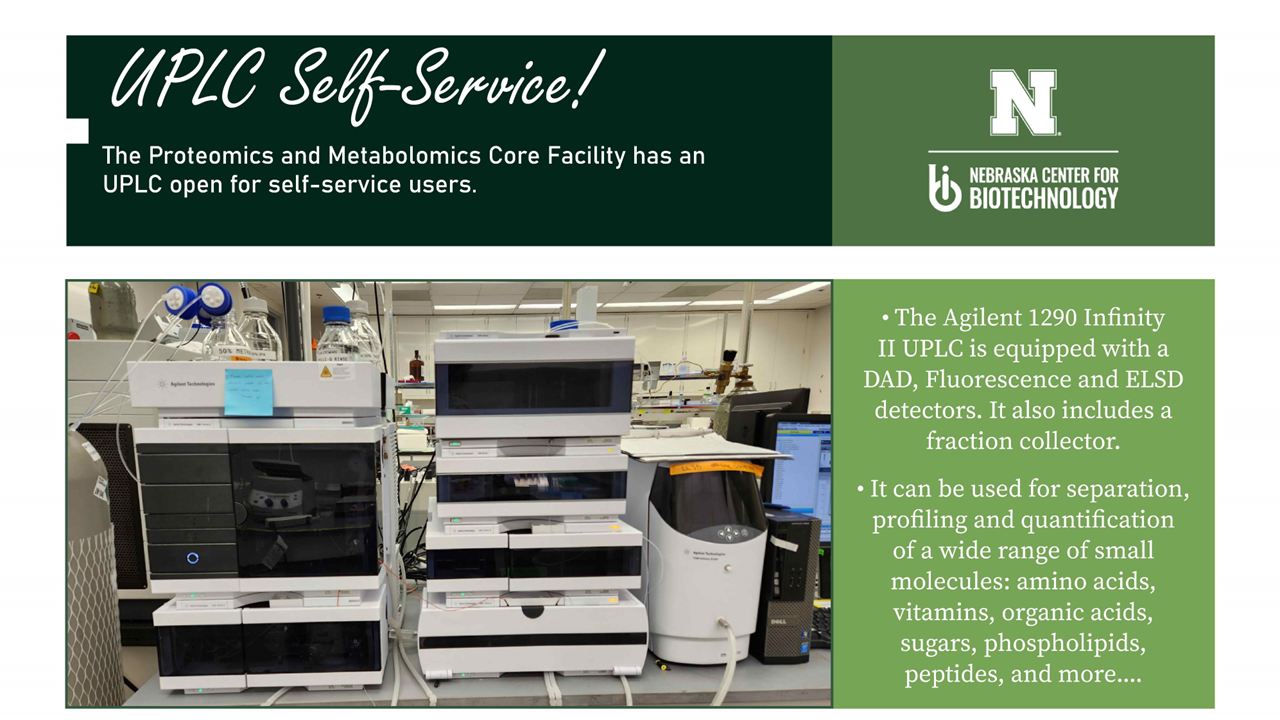
Metabolite Equipment for Self Service Use
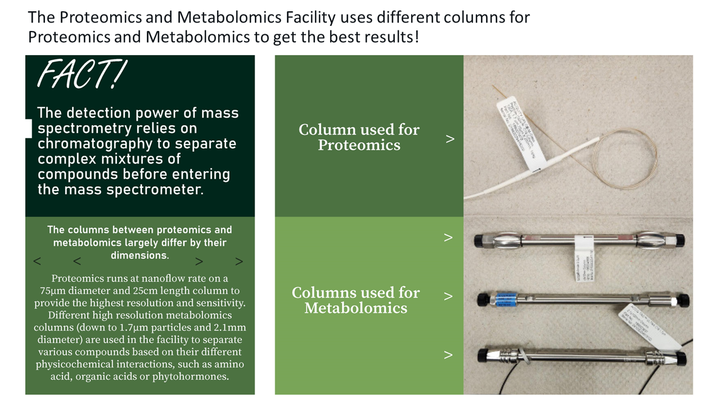
Columns Used for Proteomics and Metabolomics Work
Self-Service use of UPLC
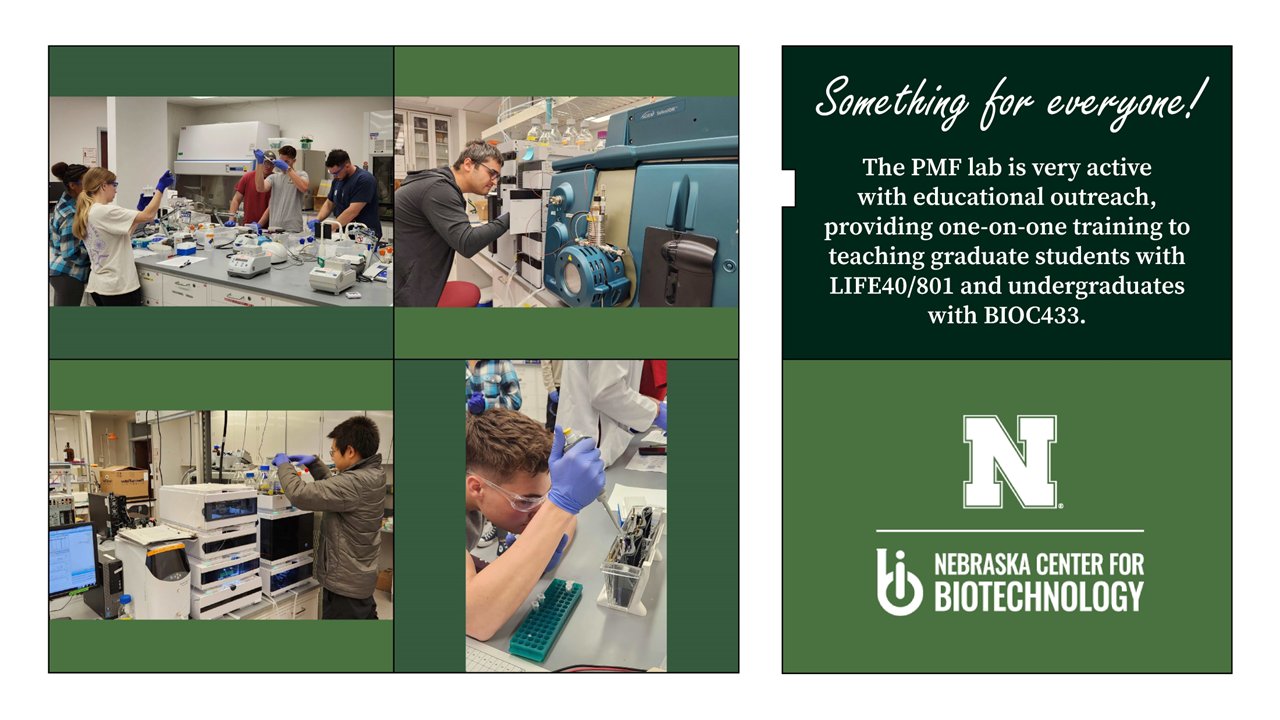
Outreach in PMF
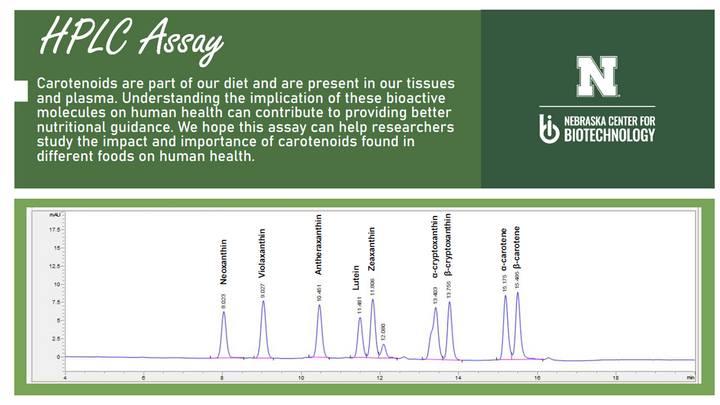
HPLC Assay
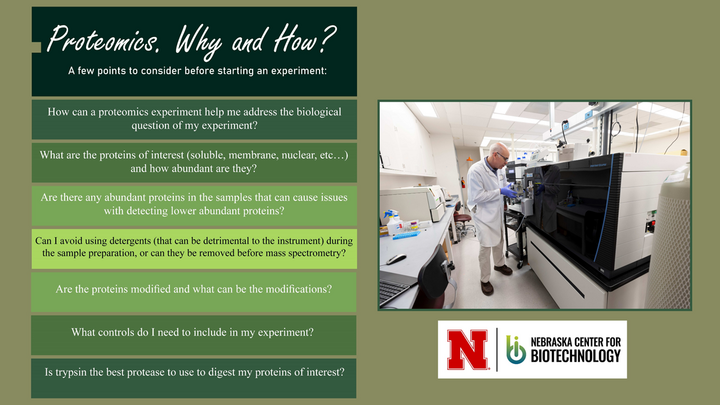
Proteomics: Why and How?
Director Spotlights
Daniel Schachtman - Director
Dirk Anderson - Flow Cytometry Director
Eduardo Romero - CryoEM Director
Jean-Jack M. Riethoven - Bioinformatics Director
Sophie Alvarez - Proteomics and Metabolomics Director
Y. Joe Zhou - Microscopy Director
Team Member Spotlights
Bara Altartouri - Researcher, Microscopy
Terri Fangman - Retired Lab Manger, Microscopy
Chia Sin - Bioinformatician, Bioinformatics